Health × Coastal Flooding
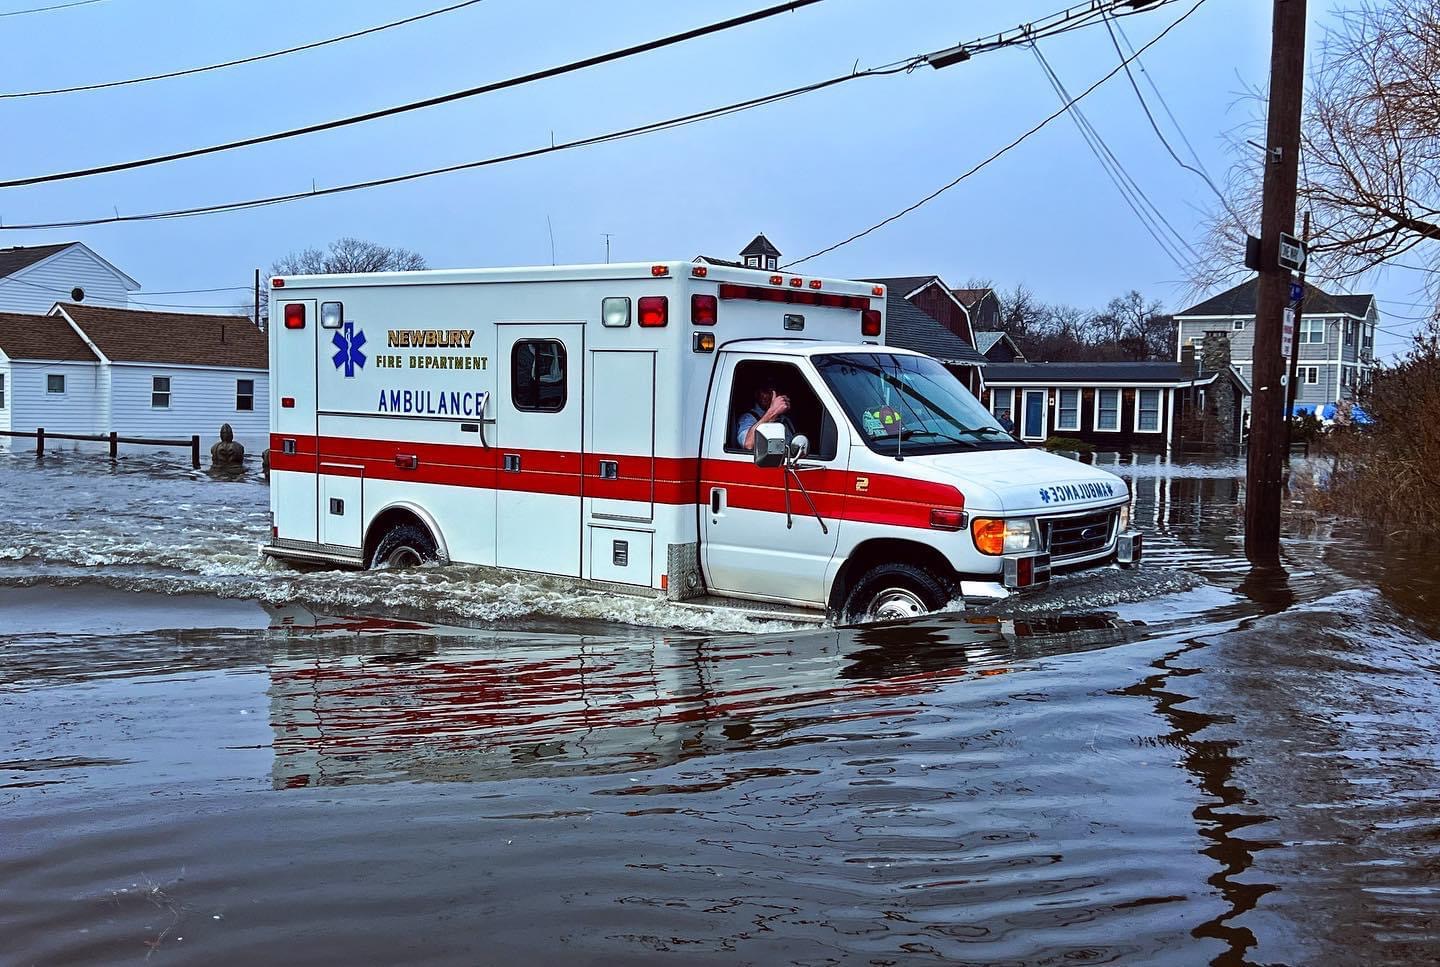
More than half of Massachusetts residents live in coastal areas, making them susceptible to the health risks of coastal flooding, especially environmental justice and priority populations (ResilientMass Plan, 2023, p. 3-11). There are several health risks of coastal flooding including those caused by power outages, mold, or contact with flood water contaminated with sewage and chemicals or carrying debris and physical hazards.
Loss of electricity can put people at risk of carbon monoxide poisoning, as well as medical emergencies due to the loss of medical equipment function and/or spoiled medications. Additionally, the moisture from flooded homes and buildings can result in the growth of mold, which can cause allergic reactions and respiratory illness. The populations that are vulnerable to these impacts include people over 65, children under 5, people with compromised immune systems, people with allergies, and people with respiratory conditions such as asthma (MEPHT, 2024).
Contact with contaminated flood water can cause skin, eye, and wound infections as well as gastrointestinal illnesses, which is especially harmful for people over 65, children under 5, pregnant persons, people with compromised immune systems and people with limited English proficiency. Coastal flooding can also contaminate wells with pathogens or salt water, either from direct flooding over land or by raising the water table, resulting in salinization of underground fresh water sources (MEPHT, 2024).
This guide will allow you to explore the impacts of coastal flooding on human health, learn who is most likely to be impacted and identify existing resources to support communities.
Questions to Answer
The questions and guided explorations below are designed to assist you with thinking about how coastal flooding may impact human health. Use the Health x Coastal Flooding worksheet to assist you when answering these questions.
The questions and guided explorations below are designed to assist you with thinking about how coastal flooding may impact human health. Use the Health x Coastal Flooding worksheet to assist you when answering these questions.
There are a variety of health hazards associated with power outages. During power outages, many people turn to alternative sources of energy for heating, cooling, or cooking. Appliances such as stoves, generators, and lanterns can produce carbon monoxide (CO), an odorless and colorless gas. If these appliances are used in enclosed or partially enclosed spaces, the CO can build up, poison and can cause death if breathed in (CDC, 2024).
During a power outage, loss of refrigeration may make food unsafe to eat leading to food-borne illness. During this time, municipal water purification systems may also be down making it unsafe to consume water (CDC, 2024). Also, some people may take medications that require refrigeration such as insulin or utilize medical devices that require electricity such as breathing machines, power wheelchairs, and electric beds (MEPHT, 2024). Not being able to take medications or utilize medical devices can have significant health impacts including worsening chronic conditions and limiting mobility.
In addition to people over 65, children under 5, pregnant persons, and people with compromised immune systems, research suggests that EJ communities are also at higher risk of negative health outcomes during power outages because they may have less access to back up power (MCCA, 2022, Volume II, p. 67).
Guided Exploration:
This guided exercise will help you consider how your community can minimize impacts from power outages during coastal flooding events, including identifying who is most vulnerable.
Open the GEAR Health Map and select a municipality. Expand the Climate Hazard Data group and add the Coastal Flooding layer. Discuss the following:
- Do the facilities in your community that predominantly serve vulnerable populations have preparation in place to protect these individuals from coastal flooding (i.e. Day cares, schools, health centers, and long-term care residences)?
- Click on the 3 dots to the right of the Coastal Flooding layer and adjust transparency to 50%. Turn on the Community Components group and drop down to explore the layers below, including Long Term Care Residences, Licensed Child Care Programs, and/or Schools PK-12 layer(s). Select the Community Health Resources group and explore the Community Health Centers layer below it. Are any of these facilities locate in areas prone to coastal flooding?
- Expand and explore layers in the EJ and Other Priority Populations group. Are any of the EJ populations in areas prone to coastal flooding?
- Does your local health department or municipality have guides on preventing carbon monoxide (CO) poisoning?
- The CDC provides information on how to prevent CO poisoning.
- Does your local health department or municipality have guides on food safety during a power outage? Water safety? Medication safety?
- Consider those in your community that may be the most vulnerable to food spoilage and/or reduced water quality including people over 65, children under 5, pregnant persons, and people with compromised immune systems. How can your community tailor guidance to these populations?
- The CDC also offers guidance for how communities can engage in food, water, and medication safety during power outages.
Read More About Related Impacts in the Massachusetts Climate Change Assessment:
- Health Effects of Extreme Storms and Power Outages page ES8 (top impact Greater Connecticut River Valley)
Extreme weather conditions, like coastal flooding, can lead to the infiltration of water into indoor spaces. The dampness that follows can create conditions that lead to the growth of fungus and bacteria that can cause significant health impacts (Institute of Medicine, 2011, p. 134). Research has shown that exposure to mold can increase the risk of developing asthma or have worsening symptoms, particularly in young children (Institute of Medicine, 2011, p. 136). One study found that infants that lived in homes with mold, were 3 times more likely to develop asthma by the age of 7 (Reponen et. al, 2011).
Other vulnerable populations include people with compromised immune systems, people with allergies, and people with respiratory conditions such as asthma (MEPHT, 2024). Additionally, exposure to mold can cause allergic reactions which include symptoms such as a runny nose, sneezing, coughing, and wheezing (NIH, 2025). Some people may even experience irritation of the eyes, a sore throat, congestion, skin rashes, and headaches (Bozek and Pyrkosz, 2017).
Flood waters may also contain unknown objects and other hazards that may have impacts on human health. For example, flood water may contain sharp objects such as glass or metal fragments that can lead to injury and infection as well as electrical hazards such as downed power lines (CDC, 2024). Research shows that utility and rescue workers, as well as adolescents and young adults are at high risk of injury from flooding. Additionally, flood waters may contain biological hazards that can lead to infection, especially in vulnerable populations such as people over 65, children under 5, pregnant persons, people with compromised immune systems and people with limited English proficiency (MEPHT, 2024). Exposure to contaminated flood water may lead to conditions such as wound infections, skin rashes, gastrointestinal illness, and tetanus (CDC, 2024).
Guided Exploration:
This guided exercise will help evaluate your community’s ability to ensure health and safety during and after high coastal flood waters.
Open the GEAR Health Map and select a municipality. Expand the Climate Hazard Data group and add the Coastal Flooding layer. Discuss the following:
- Does your local health department or municipality have guides on preventing mold growth after a flood? Are they tailored to populations most at risk of mold growth?
- Consider populations most vulnerable to the health impacts of mold growth (children under 5, people with compromised immune systems, people with allergies, and people with respiratory conditions such as asthma). In the map, select and expand the Public Health Data group. Explore the Pediatric Asthma Rates (2023-24 school year) or Asthma Hospitalizations (2021) layers to identify the rates of asthma among children in your community or overall asthma hospitalizations. Use local knowledge to consider whether the mapped coastal flooding areas are densely populated and likely to exacerbate asthma in your community.
- The CDC provides information on how to prevent mold growth.
- Does your municipality have safety protocols for residential, public, and school buildings that requires assessing and remediating mold?
- Consider populations most vulnerable to the health impacts of mold growth. Do the facilities in your community that predominantly serve these populations (i.e. pre-schools and health centers) have preparation in place to protect these individuals?
- In the map, turn on the Community Health Resources and Community Components groups to see if any of these facilities are located in the flood zone.
- DPH offers resources on mold, moisture, and mildew for mutliple audiences.
- Does your local health department or municipality have guides for workers on preventing injuries during flood response?
- The CDC provides information for workers on flood response and recovery.
Read More About Related Impacts in the Massachusetts Climate Change Assessment:
Investigate GEAR Map Data Layers
Explore the Health Map to learn more about how coastal flooding may impact healthcare outcomes and access in your community. The list at the right provides an overview of the data layers included in the map, as well as details about each layer.
Explore the Health Map to learn more about how coastal flooding may impact healthcare outcomes and access in your community. The list at the right provides an overview of the data layers included in the map, as well as details about each layer.


This layer shows the locations of both acute and
non-acute care hospitals in Massachusetts that provide primary care,
preventative care, and specialty care, as well as emergency care and trauma
care.
These non-profit community-based organizations offer comprehensive primary care, including medical, socal and/or mental health services, to anyone in need regarless of their medical status, ability to pay, culture, or ethnicity. Additional services may include translation, workforce development, training, and education. Before, during, and after emergencies, Community Health Centers provide essential information, resources, and care.
As
sea levels rise, communities can benefit from understanding when, where, and
how coastal flooding from sea level rise and storm surge may occur. This layer
provides extents of flooding for the 0.1% annual exceedance probability for
2030, 2050, and 2070 (i.e. the extent that flood waters will reach during a
0.1% event, or a 1 in 1000 chance for any given storm event).
As sea levels rise, communities can benefit from understanding when, where, and how coastal flooding from sea level rise and storm surge may occur. This layer provides extents of flooding for the 1% annual exceedance probability for 2030, 2050, and 2070 (i.e. the extent that floodwaters will reach during a 1 in 100 chance for any given storm event).
Environmental justice (EJ) populations, i.e., block groups are defined in Chapter 8 of the Acts of 2021 and the 2021 EEA EJ Policy. EJ populations are those segments of the population that EEA has determined to be most at risk of being unaware of or unable to participate in environmental decision-making or to gain access to state environmental resources or are especially vulnerable. 2020 block groups, updated in Nov 2022.
Childcare Centers provide care and educational services for their clients, but can also provide essential resources and information. For example, parents and guardians may rely on services which provide their child with social and emotional wellness, meals, and child supervision during work hours. This layer displays information from MassGIS.
This layer contains the locations of licensed
nursing homes, rest homes and assisted living residences in Massachusetts.
Those living and working in these facilities may be more vulnerable to climate
impacts like power outages and heat waves, which can further existing health
and mobility challenges that residents may have and staff persons need to
navigate.
Schools attended by students from
pre-kindergarten through high school provide educational services for those
students, but also provide essential resources and information. For example,
caregivers may rely on services which provide their child with social and
emotional wellness, meals, and before- and after-school care. Schools often
have a strong understanding of food insecurity and other challenges among their
student body. They may also play a role in emergency response.
Actions to Consider
Communities can take a number of actions to increase resilience to coastal flooding. The Climate Resilience Playbook can provide a filtered set of actions related to this GEAR guide. You may also toggle additional filters to find additional actions most relevant for your community.
Communities can take a number of actions to increase resilience to coastal flooding. The Climate Resilience Playbook can provide a filtered set of actions related to this GEAR guide. You may also toggle additional filters to find additional actions most relevant for your community.
Explore MVP Projects
Explore the MVP funded projects below:
Explore the MVP funded projects below:
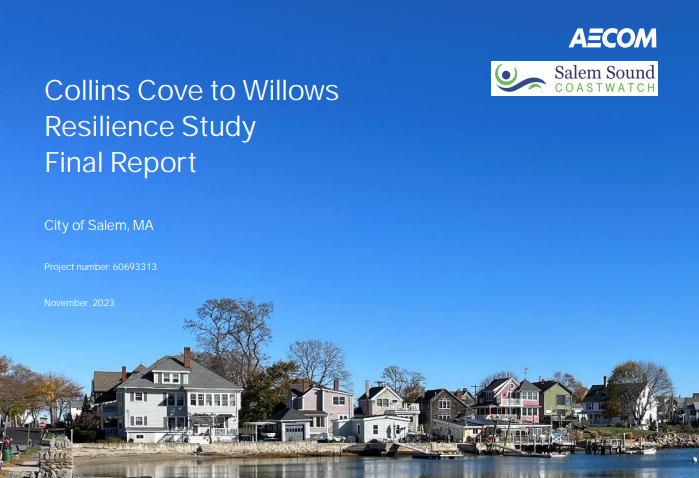
The primary goal of this study was to conduct a thorough assessment of the vulnerability and risk of the Collins Cove to Willows area, specifically related to coastal and inland flooding, and develop resilience options for identified priority areas. Also, a strong public engagement effort was completed to ensure the voices of those living in the study area were incorporated into the assessment.
The primary goal of this study was to conduct a thorough assessment of the vulnerability and risk of the Collins Cove to Willows area, specifically related to coastal and inland flooding, and develop resilience options for identified priority areas. Also, a strong public engagement effort was completed to ensure the voices of those living in the study area were incorporated into the assessment.
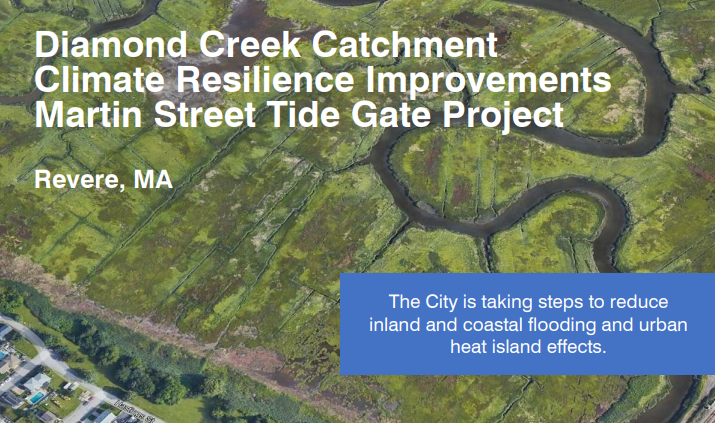
FY24-25 Action Grant
$386,911 Award
This project:
- Completed preliminary (30%) and advanced (75%) design of tide gate improvements for the Martin Street tide gate
- Monitored tidal water levels at Martin Street tide gate and the upstream Central County Ditch Marsh to better understand current conditions
- Held numerous meetings with regulatory agencies and obtained MEPA EENF Certificate and single EIR scope
- Utilized tidal water level data and updated existing hydrologic and hydraulic model of the watershed to better understand current conditions, forecast future conditions, assess impacts of potential improvements, and begin developing a proposed O&M plan