Health × Drought
Increasing temperatures and changes in precipitation are expected to increase the length and frequency of droughts as well as their intensity. In addition to changes in climate, drought conditions are influenced by human activity such as land use change, dams, as well as the withdrawal or diversion of water supplies (ResilientMass Plan, 2023, p. 5.1-40).
Depending on the severity and duration, drought can have significant impacts on human health. Water quality degradation caused by drought can be harmful, especially to vulnerable groups such as people over 65, children under 5, pregnant persons, and people with compromised immune systems (MEPHT, 2024). Health risks in exposure to poor water quality include gastrointestinal illnesses and exposure to chemicals such as nitrate, arsenic and uranium (MEPHT, 2024). Additional impacts include reduction in food safety and security, decrease in yields or dry wells for residents who depend on private water supplies, as well as increases in prices and rationing of water for people who depend on public water suppliers (ResilientMass Plan, 2023, p. 5.1-41).
Drought can also increase incidence of wildfires (ResilientMass Plan, 2023, p. 5.1-60) which can be a threat to public health and safety, food sources and infrastructure. Socioeconomic impacts of drought include reduced incomes, displacement of workers such as farm workers, and fewer recreational opportunities (NDMC, 2025).
This guide will allow you to explore the impacts of drought on human health, learn who is most likely to be impacted and identify existing resources to support communities.
Questions to Answer
The questions and guided explorations below are designed to assist you with thinking about how drought may impact human health through water and air quality and identify who is most vulnerable in your community. Use the Health x Drought worksheet to assist you when answering these questions.
The questions and guided explorations below are designed to assist you with thinking about how drought may impact human health through water and air quality and identify who is most vulnerable in your community. Use the Health x Drought worksheet to assist you when answering these questions.
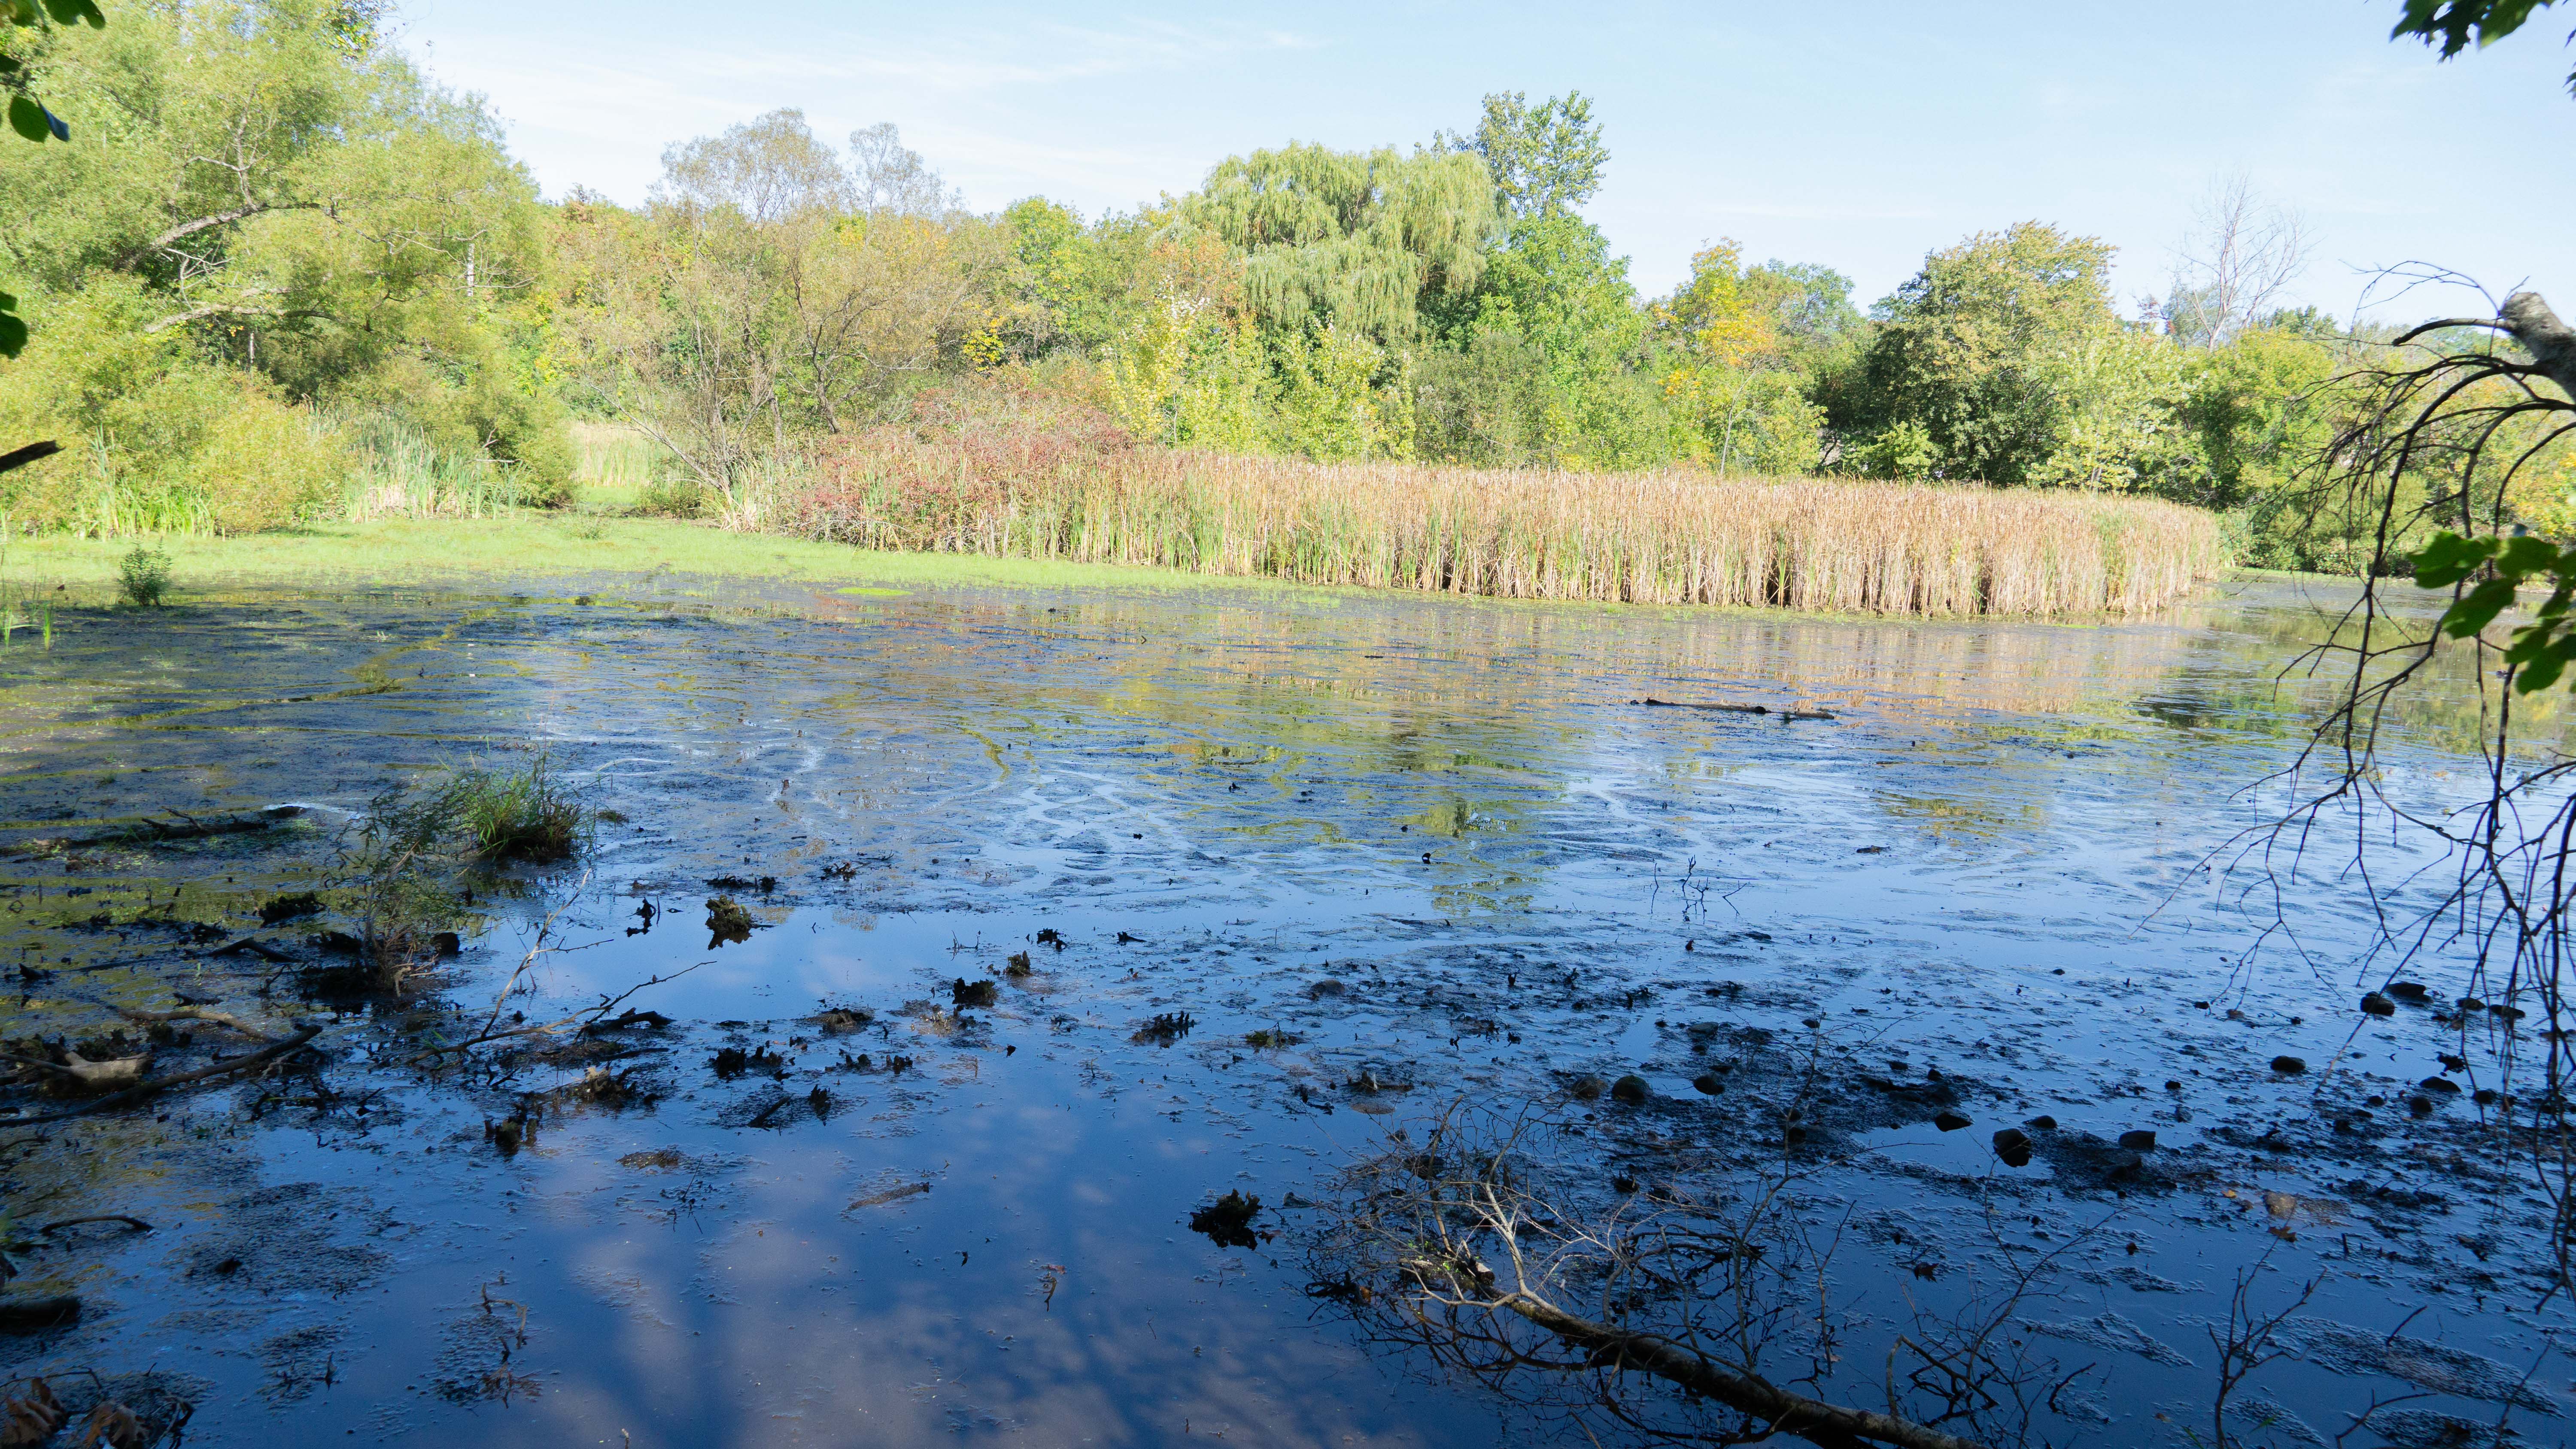
Clean water is essential to human health, infrastructure, and the economy. Communities rely on water utilities for domestic use, agriculture, industry, and more. However, drought can affect water quality, impacting the wellbeing of communities.
During drought, low water levels can cause water to warm which can cause the growth of microbes. During recreation, accidental or intentional swallowing of water during a drought can expose persons to bacteria, viruses, and protozoans that can cause waterborne disease (CDC, 2024). Some of the most common infections contracted during water recreation such as swimming are diarrhea, rashes, ear infections, and irritation of the eyes or respiratory tract. Children, pregnant persons, and those with compromised immune systems are at high risk for such infections (CDC, 2025).
During water shortages, farmers may use recycled water to irrigate their crops. However, if the water is not properly treated, food may become contaminated with bacteria like E. coli and Salmonella which can be especially harmful to vulnerable populations. Microbes can also contaminate groundwater and surface water during a lack of rainfall, which can put those who rely on drinking water from private wells at risk of infectious disease (CDC, 2024).
Low surface water levels can increase the risk of injury. For example, diving into shallow water or striking objects that may not be easily visible during boating can cause life-threatening injuries. Low water levels may also expose dangerous debris at the bottom of bodies of water (CDC, 2024).
Guided Exploration:
This guided exercise will help you reflect on how reduced quantity and quality of water during droughts affects your community.
Open the GEAR Health Map and select a municipality. Expand the Climate Hazard Data group and turn on Drought Vulnerability, which will show a drought score based on drought history from 2001 to 2025. Discuss the following:
- Who is most vulnerable to the impacts of low water quality and availability (persons over 65, children under 5, pregnant persons, people with compromised immune systems) in your community? Do the institutions in your community that predominately serve or work with these populations have measures in place to prepare for drought?
- Consider day cares, schools, health centers, and long-term care residences such as nursing homes, rest homes, and assisted living facilities. In the map, click on the 3 dots to the right of Drought Vulnerability and adjust the transparency to 50%. Turn on and expand the Community Components group to explore the Long Term Care Residences, Licensed Child Care Programs, and/or Schools PK-12 layer(s). Select the Community Health Resources group and explore the Community Health Centers layer below it. Are any of these facilities in areas currently experiencing drought?
- The Massachusetts Water Resources Commission provides information on water conservation for various municipal sectors, along with a library of infographics on water conservation to help with community outreach.
- Do you know what percentage of your community relies on private wells?
- What does your community do when they don't have access to water? Do some community members store water? EEA provides information for private well owners during a drought.
- Do community members who rely on private well water have access to resources regarding safe disinfection procedures? Is your local Board of Health prepared to assist with questions related to private well water safety? The MassDEP Drinking Water Program provides recommendations for private wells inundated by flooding.
- Using the map and local knowledge, identify water bodies in your community that are often used for recreation. Select the Public Recreation group and open the dropdown to turn on the Other DCR Swimming Areas and Massachusetts Water Features layers. Does your municipality and/or local health department have guides for safe recreation during droughts?
- Mass DPH tests official swimming areas for e-coli and enterococci on a regular basis during the swimming season. Information on beach water quality and beach closures can be a guide for other recreational activities. The Interactive Beach Water Quality Dashboard is updated daily during the beach season.
- The CDC provides information on how to safely visit natural water bodies for recreation.
- How can you support agricultural spaces in preparation and response to drought?
- The Massachusetts Water Resource Commission provides information on water conservation for agriculture. Discuss what types of agriculture are in your community and how you can support them during droughts. For more in-depth exploration, see the Food + Water x Drought guide.
Read More About Related Impacts in the Massachusetts Climate Change Assessment:
- Reduction in Clean Water Supply page A60 (top impact Berkshires & Hilltowns; Cape, Islands & South Coast)
- Decrease in Agricultural Productivity page 139 (top impact Greater Connecticut River Valley)
Conditions caused by drought such as dustiness, dryness, and wildfires can impact health, particularly of those with chronic respiratory conditions. Particles in the air from fire and dry soil such as pollen and smoke can irritate the lining of the respiratory system, exacerbating conditions like asthma, and can even increase the risk of infections like bronchitis and bacterial pneumonia (CDC, 2024).
Research has shown that air pollution can also impact heart health, increasing the risk of heart attacks, stroke, and irregular heart rhythms. Those at higher risks of heart conditions associated with low air quality include older adults, those with a family history of stroke or heart disease, those who have high blood pressure or high cholesterol, those who are overweight or not physically active and smokers (EPA, 2018). Children may also be more sensitive to low air quality, especially children with asthma (CDC, 2024). Additionally, wildfires, which can be induced by drought, can create pollutants such as PM2.5 (particulate matter with a diameter of 2.5 micrometers or less) that can be harmful to health, especially to vulnerable populations. Those at increased risk of health impacts from wildfire smoke include people with respiratory and cardiovascular conditions, children, older adults, and pregnant persons. Additional vulnerable populations include people of color due to systemic racism, people with lower incomes, and outdoor workers (EPA, 2024).
Guided Exploration:
This guided exercise will help you discuss ways to inform and protect your community during periods of poor air quality.
Open the GEAR Health Map and select a municipality to begin considering:
- Who is most vulnerable to the impacts of poor air quality? Expand the Environmental Justice (EJ) and Other Priority Populations group. Explore the various layers to see who lives in your community.
- Those with asthma, especially children, are at risk of health impacts for poor air quality. Select the Public Health Data group, dropdown and explore the Pediatric Asthma Rates (2023-24 school year) or Asthma Hospitalizations (2021) layer to identify the rates of asthma among children in your community or overall asthma hospitalizations.
- Do the schools in your municipality have regulations for outdoor activities during periods of poor air quality?
- The CDC provides guidance for outdoor activities for schools during different levels of air quality.
- Does your local health department or municipality have alerts or an index for air quality?
- Does your local health department or municipality have communications for how your most vulnerable communities can protect themselves during periods of poor air quality?
- DPH offers a poor outdoor air quality fact sheet and a wildfire smoke events fact sheet in 16 languages
Read More About Related Impacts in the Massachusetts Climate Change Assessment:
- Health Effects from Degraded Air Quality page 41 (top impact Boston Harbor region; North and South Shores, Eastern Inland region)
- Air Quality, Recreation, and Health page 135
Investigate GEAR Map Data Layers
Explore the Health x Drought map to learn more about how drought may affect health outcomes within your community. The list at the right provides an overview of the data layers included in the map, as well as details about each layer.
Explore the Health x Drought map to learn more about how drought may affect health outcomes within your community. The list at the right provides an overview of the data layers included in the map, as well as details about each layer.


Drought occurs when there is a long period of low rainfall and limited water availability. Drought can strain drinking water supplies, agriculture, and ecosystems. It can also increase the risk of wildfires and reduce water quality. This MassEnviroScreen indicator reflects the level of community vulnerability to drought based on the frequency of droughts, the severity of those droughts, and the level of access to a Community Water Supply.
This feature service provides access to current drought intensity categories for the entire USA. These data have been produced weekly since January 4, 2000 by the U.S. Drought Monitor, see the Full Historical data for the full time series. Drought intensity is classified according to the deviation of precipitation, stream flow, and soil moisture content from historically established norms, in addition to subjective observations and reported impacts from more than 350 partners across the country. New map data is released every Thursday to reflect the conditions of the previous week.
This data layer displays
program sites from the Health Resources and Services Administration (HRSA), whose programs "provide
equitable health care to people who are geographically isolated and
economically or medically vulnerable." HRSA sites and programs
"deliver health services to people with HIV, pregnant people, mothers and
their families, those with low incomes, residents of rural areas, American
Indians and Alaska Natives, and those otherwise unable to access high-quality
health care."
This layer shows the locations of both acute and
non-acute care hospitals in Massachusetts that provide primary care,
preventative care, and specialty care, as well as emergency care and trauma
care.
Environmental justice (EJ) populations, i.e., block groups are defined in Chapter 8 of the Acts of 2021 and the 2021 EEA EJ Policy. EJ populations are those segments of the population that EEA has determined to be most at risk of being unaware of or unable to participate in environmental decision-making or to gain access to state environmental resources or are especially vulnerable. 2020 block groups, updated in Nov 2022.
This layer identifies hydrographic
(water-related) features, including surface water (lakes, ponds, and reservoirs),
wetlands, bogs, flats, rivers, and streams.
This layer shows DCR-owned open water swimming
beaches. Swimming areas and other recreation sites contribute to overall health
and wellbeing, providing residents from nearby communities with opportunities
to engage in physical activity, relieve stress, and connect with others, among
other healthy activities. Swimming areas also provide community members with
opportunities to cool off on days of high heat.
Childcare Centers provide care and educational services for their clients, but can also provide essential resources and information. For example, parents and guardians may rely on services which provide their child with social and emotional wellness, meals, and child supervision during work hours. This layer displays information from MassGIS.
Schools attended by students from
pre-kindergarten through high school provide educational services for those
students, but also provide essential resources and information. For example,
caregivers may rely on services which provide their child with social and
emotional wellness, meals, and before- and after-school care. Schools often
have a strong understanding of food insecurity and other challenges among their
student body. They may also play a role in emergency response.
This layer contains the locations of licensed
nursing homes, rest homes and assisted living residences in Massachusetts.
Those living and working in these facilities may be more vulnerable to climate
impacts like power outages and heat waves, which can further existing health
and mobility challenges that residents may have and staff persons need to
navigate.
Actions to Consider
Communities can take a number of actions to increase resilience to drought. The Climate Resilience Playbook can provide a filtered set of actions related to this GEAR guide. You may also toggle additional filters to find additional actions most relevant for your community.
Communities can take a number of actions to increase resilience to drought. The Climate Resilience Playbook can provide a filtered set of actions related to this GEAR guide. You may also toggle additional filters to find additional actions most relevant for your community.
Explore MVP Projects
FY 2024 Action Grant
$48,150 Award
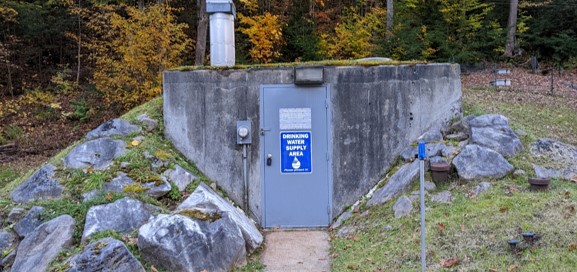
The goal of this project was to ensure flood and drought resiliency of the Briggsville Water District pump and storage tank by purchasing land upland of the current pump location in order to relocate and construct an upsized tank in the future. The main tasks of this grant was to acquire the land, conduct public outreach to Briggsville rate payers and Clarksburg residents, and consider restoration opportunities for the existing tank site once the new tank is constructed. The project met its goal of purchasing a 2.6-acre parcel upland of the existing pump, which will be the future site of a newly engineered storage and pump facility. The site is estimated to be 400 square feet, with the remaining acreage now protected from future development, thereby protecting existing habitat and wildlife.
Case Study: BWD MVP Action Grant Case Study.docx
FY 2024 Action Grant
$48,150 Award
The goal of this project was to ensure flood and drought resiliency of the Briggsville Water District pump and storage tank by purchasing land upland of the current pump location in order to relocate and construct an upsized tank in the future. The main tasks of this grant was to acquire the land, conduct public outreach to Briggsville rate payers and Clarksburg residents, and consider restoration opportunities for the existing tank site once the new tank is constructed. The project met its goal of purchasing a 2.6-acre parcel upland of the existing pump, which will be the future site of a newly engineered storage and pump facility. The site is estimated to be 400 square feet, with the remaining acreage now protected from future development, thereby protecting existing habitat and wildlife.
Case Study: BWD MVP Action Grant Case Study.docx

FY21 Action Grant
$100,650 Award
To
create a significantly more robust and resilient intermunicipal water supply
system, and to respond to citizen concerns expressed in its 2019 MVP Report,
the City of Fall River (FY21), with Dighton, Somerset, and Swansea, evaluated
the ability of the combined water supplies to provide redundancy during periods
of critical need.
Project website: Regional Emergency Water System Interconnectivity Analysis
Case study: Fall River FY21 Regional Interconnection Evaluation